Dashboard
Features
List of workflows and tasks
Once set up, the dashboard presents all tasks and workflows that have been processed through our cluster:
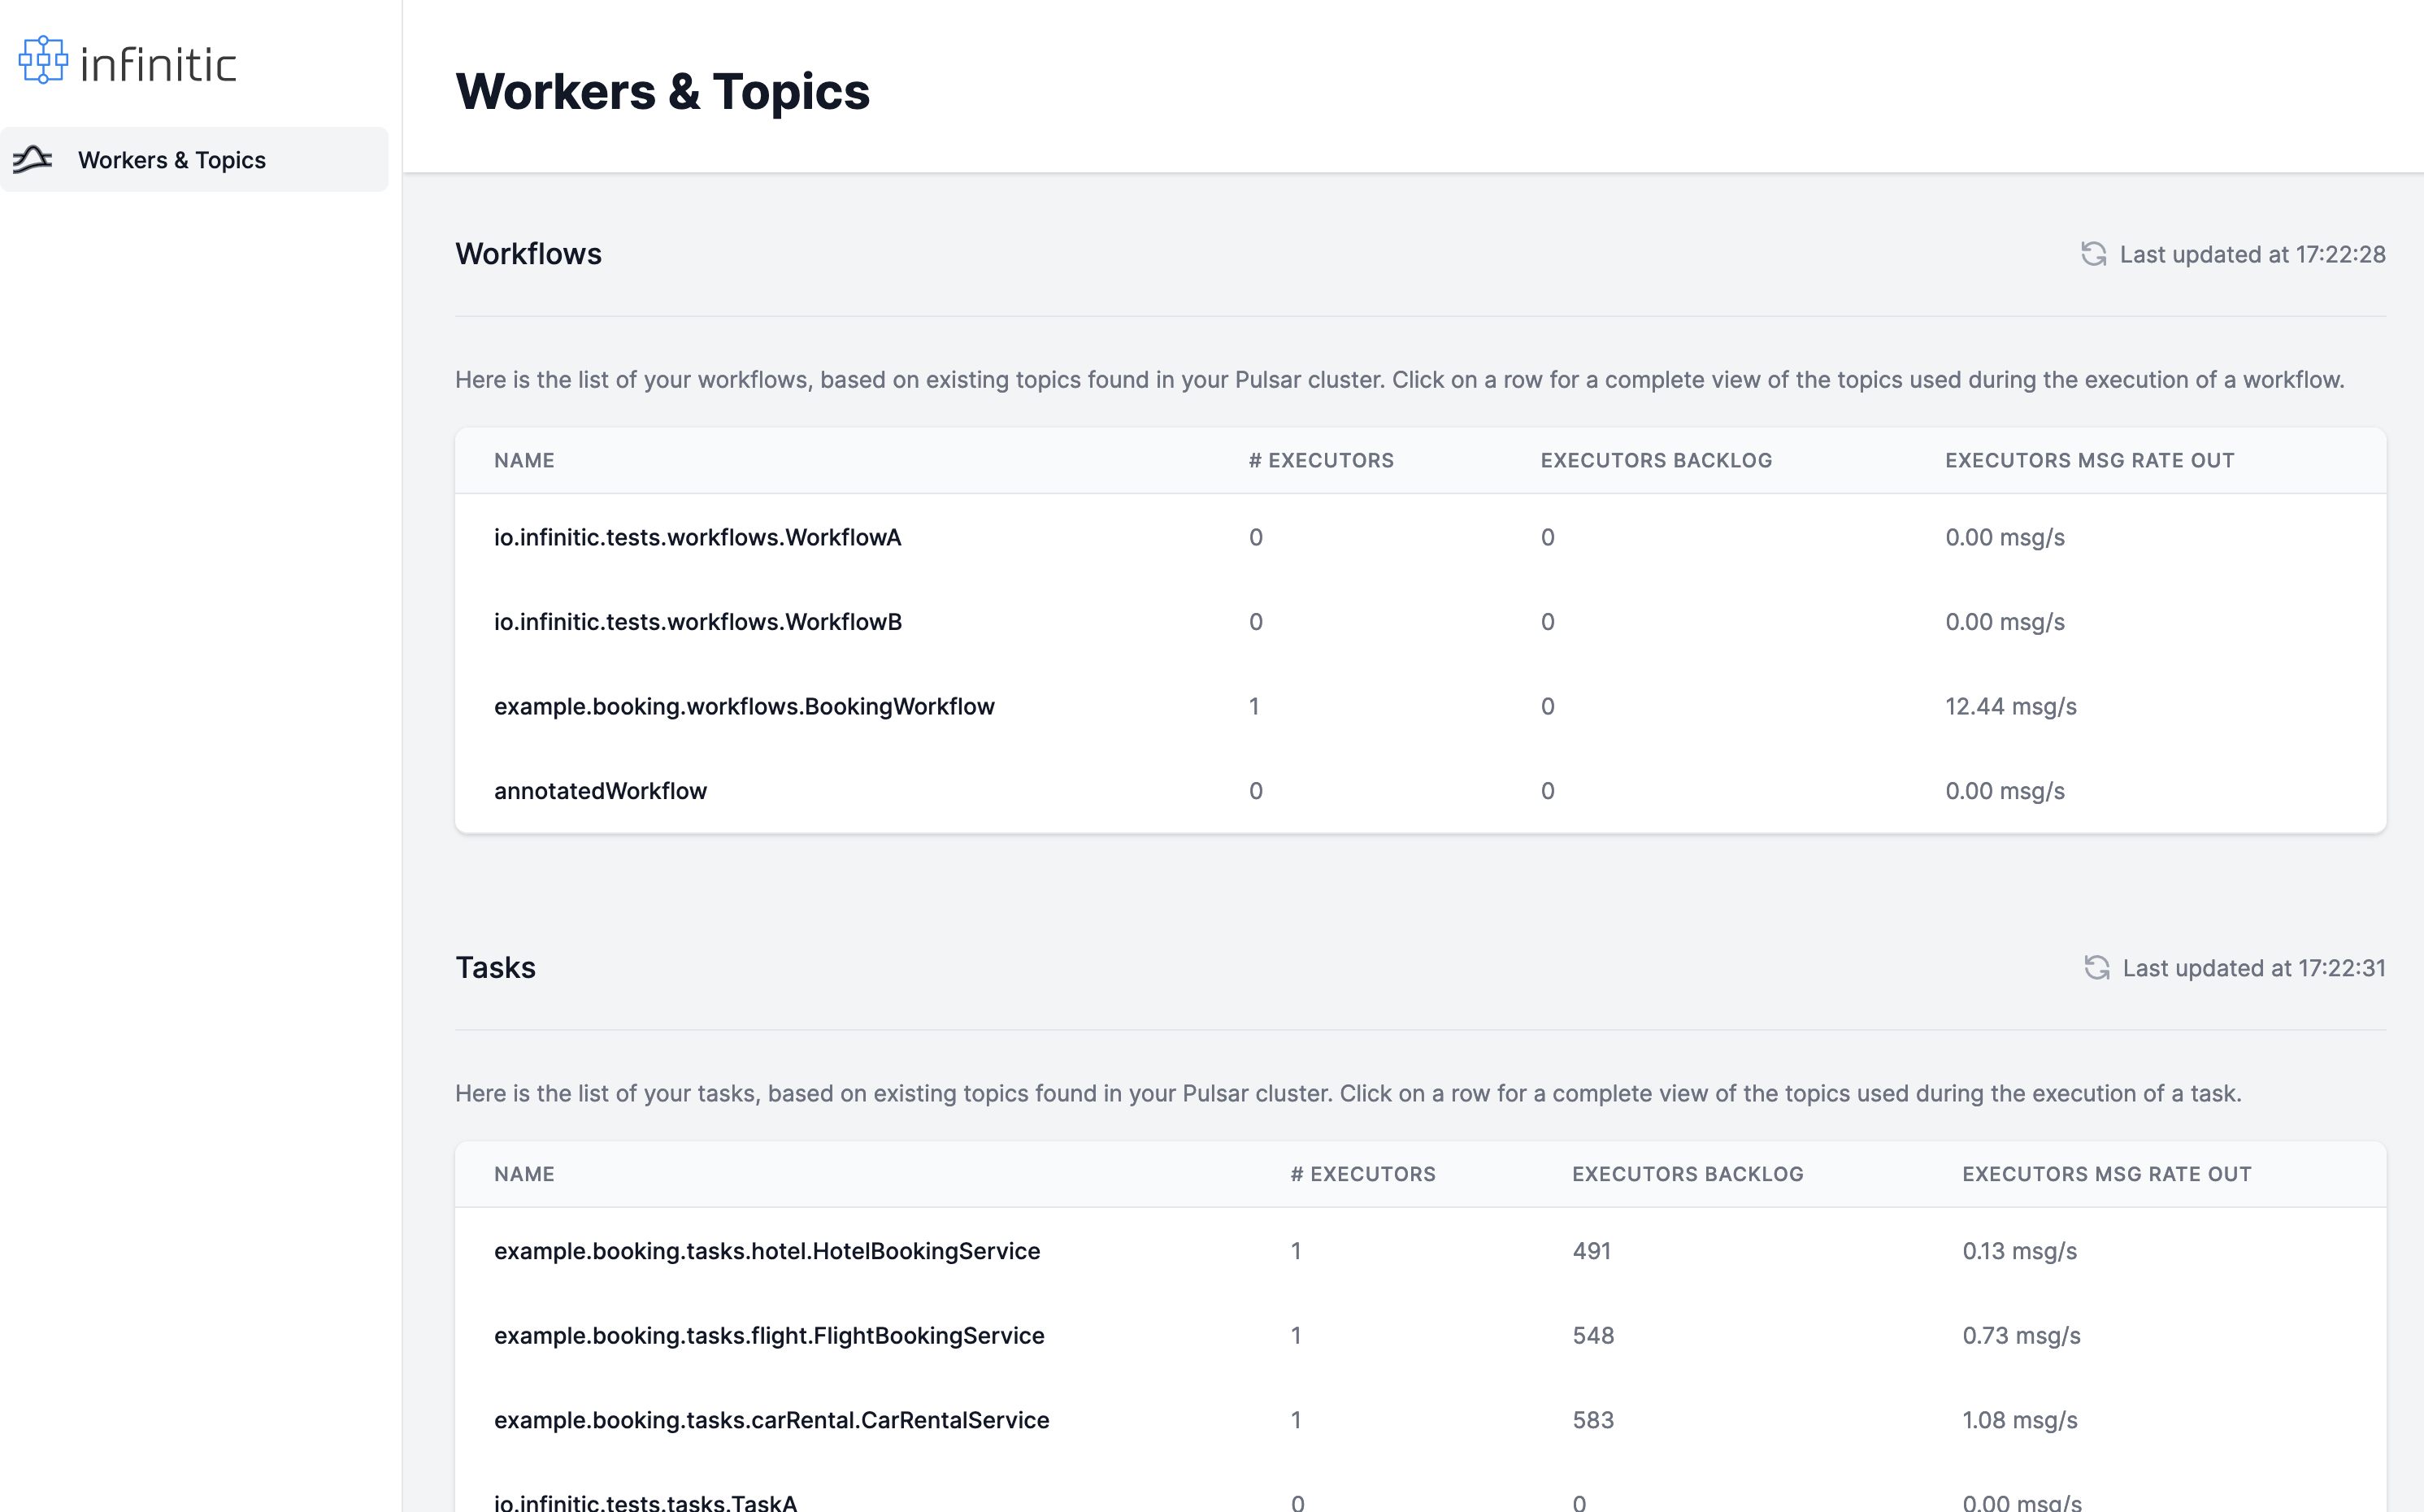
You can see at a glance the # of deployed workers and their total backlog and throughput for each of them.
For a near-real-time execution, we should have enough workers to prevent the backlog from growing.
Detail of topics used to run the workflows
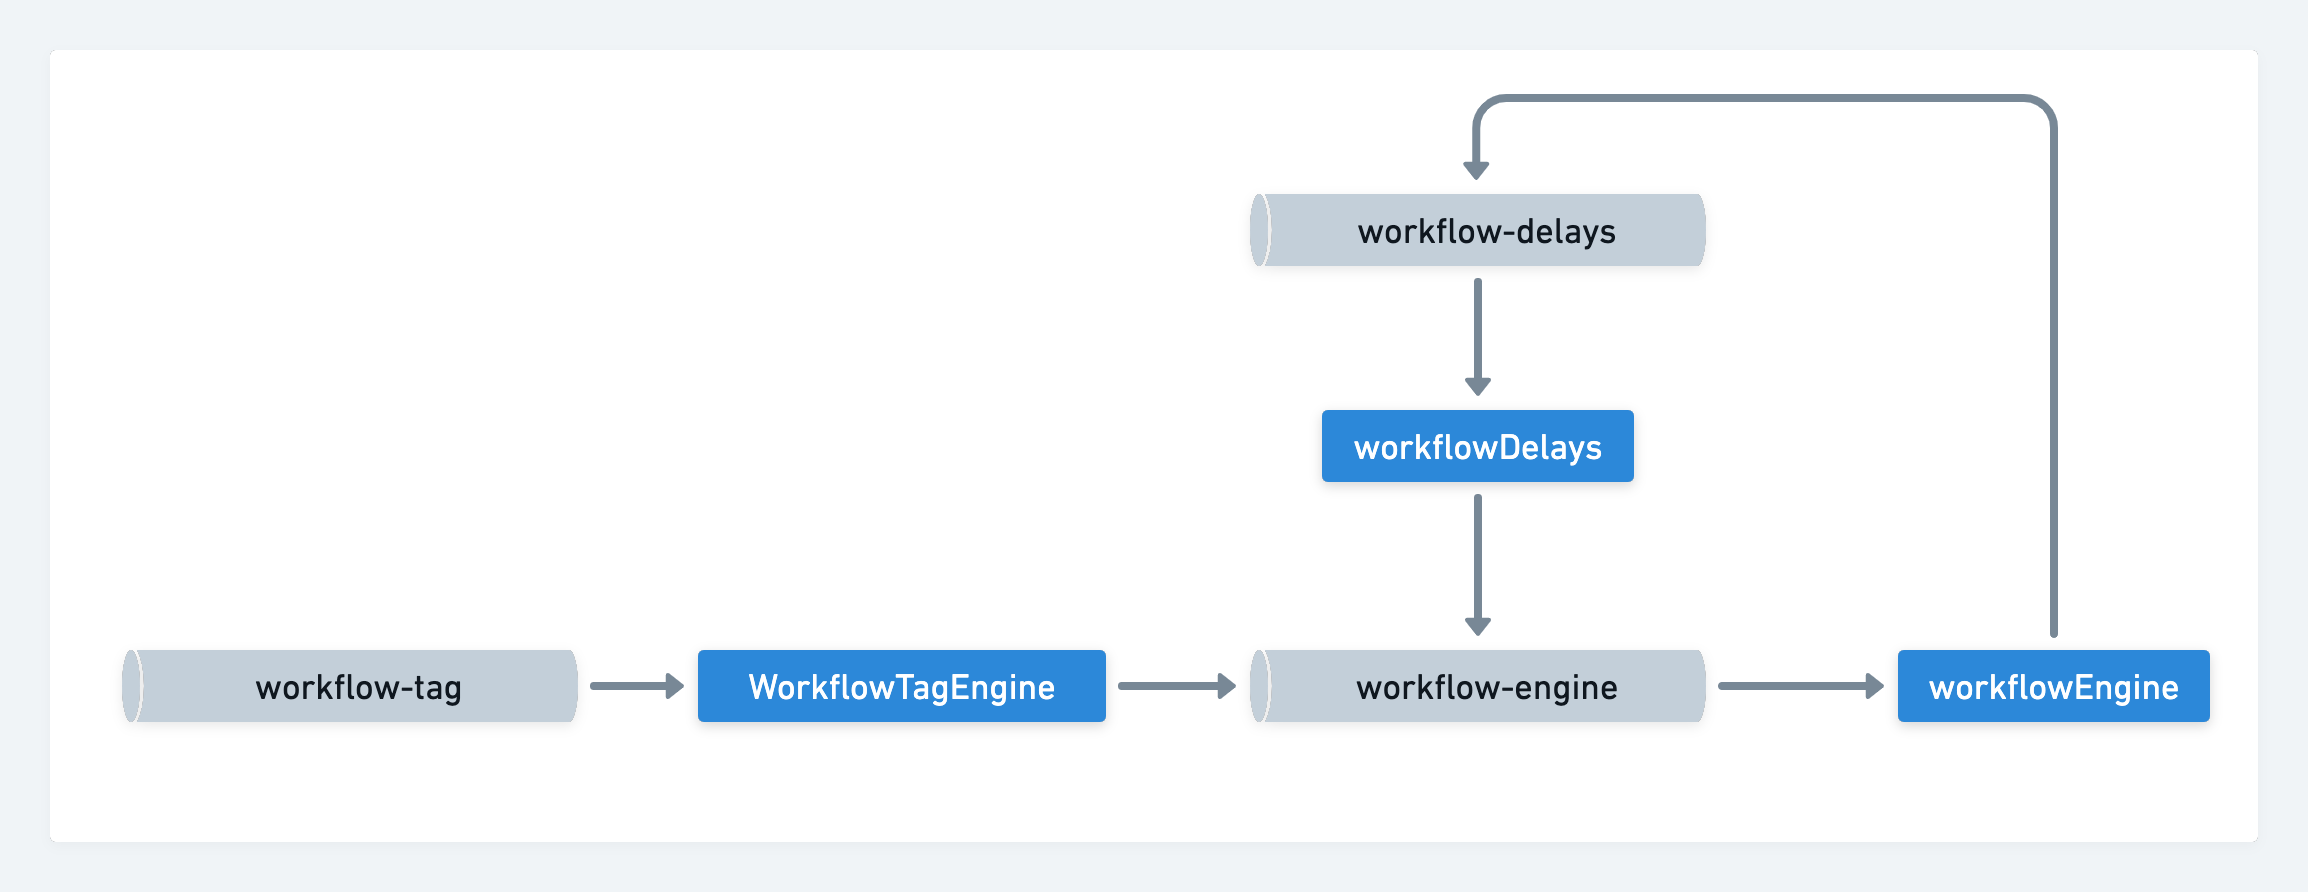
For each workflow name, a set of topics are automatically deployed on Pulsar:
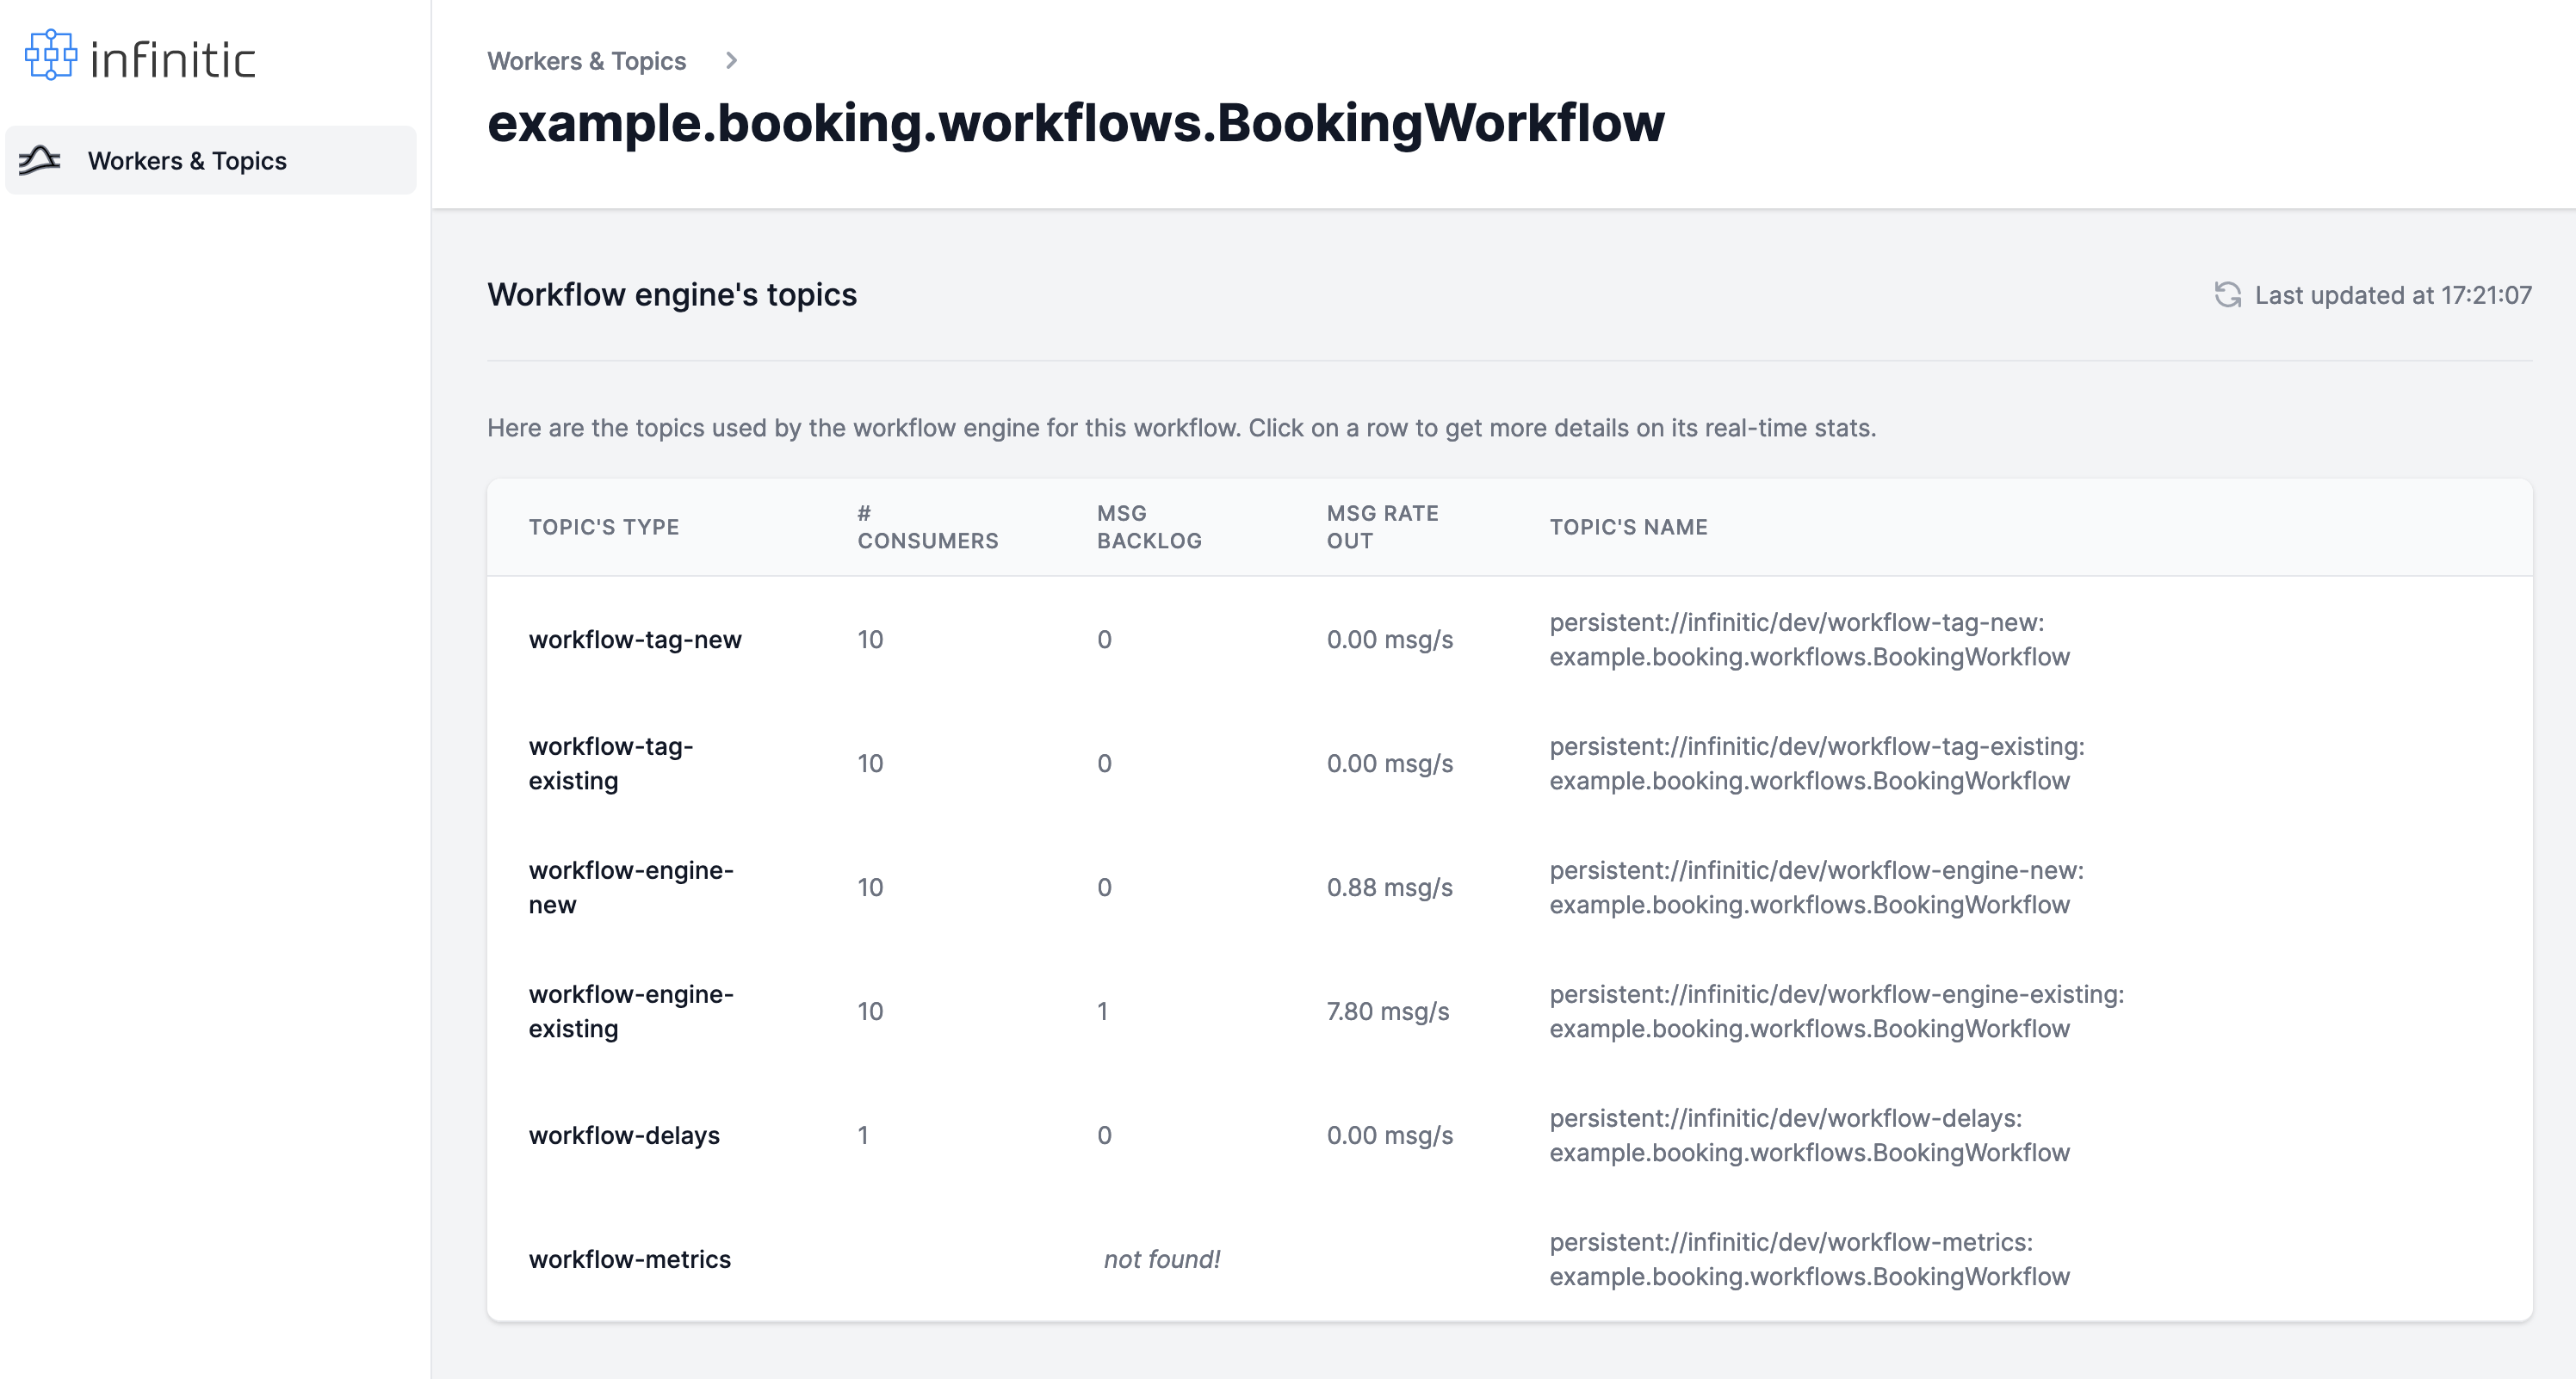
By clicking on a workflow name on the dashboard, we can see the real-time statistics of all of them:
Detail of topics used to process the tasks
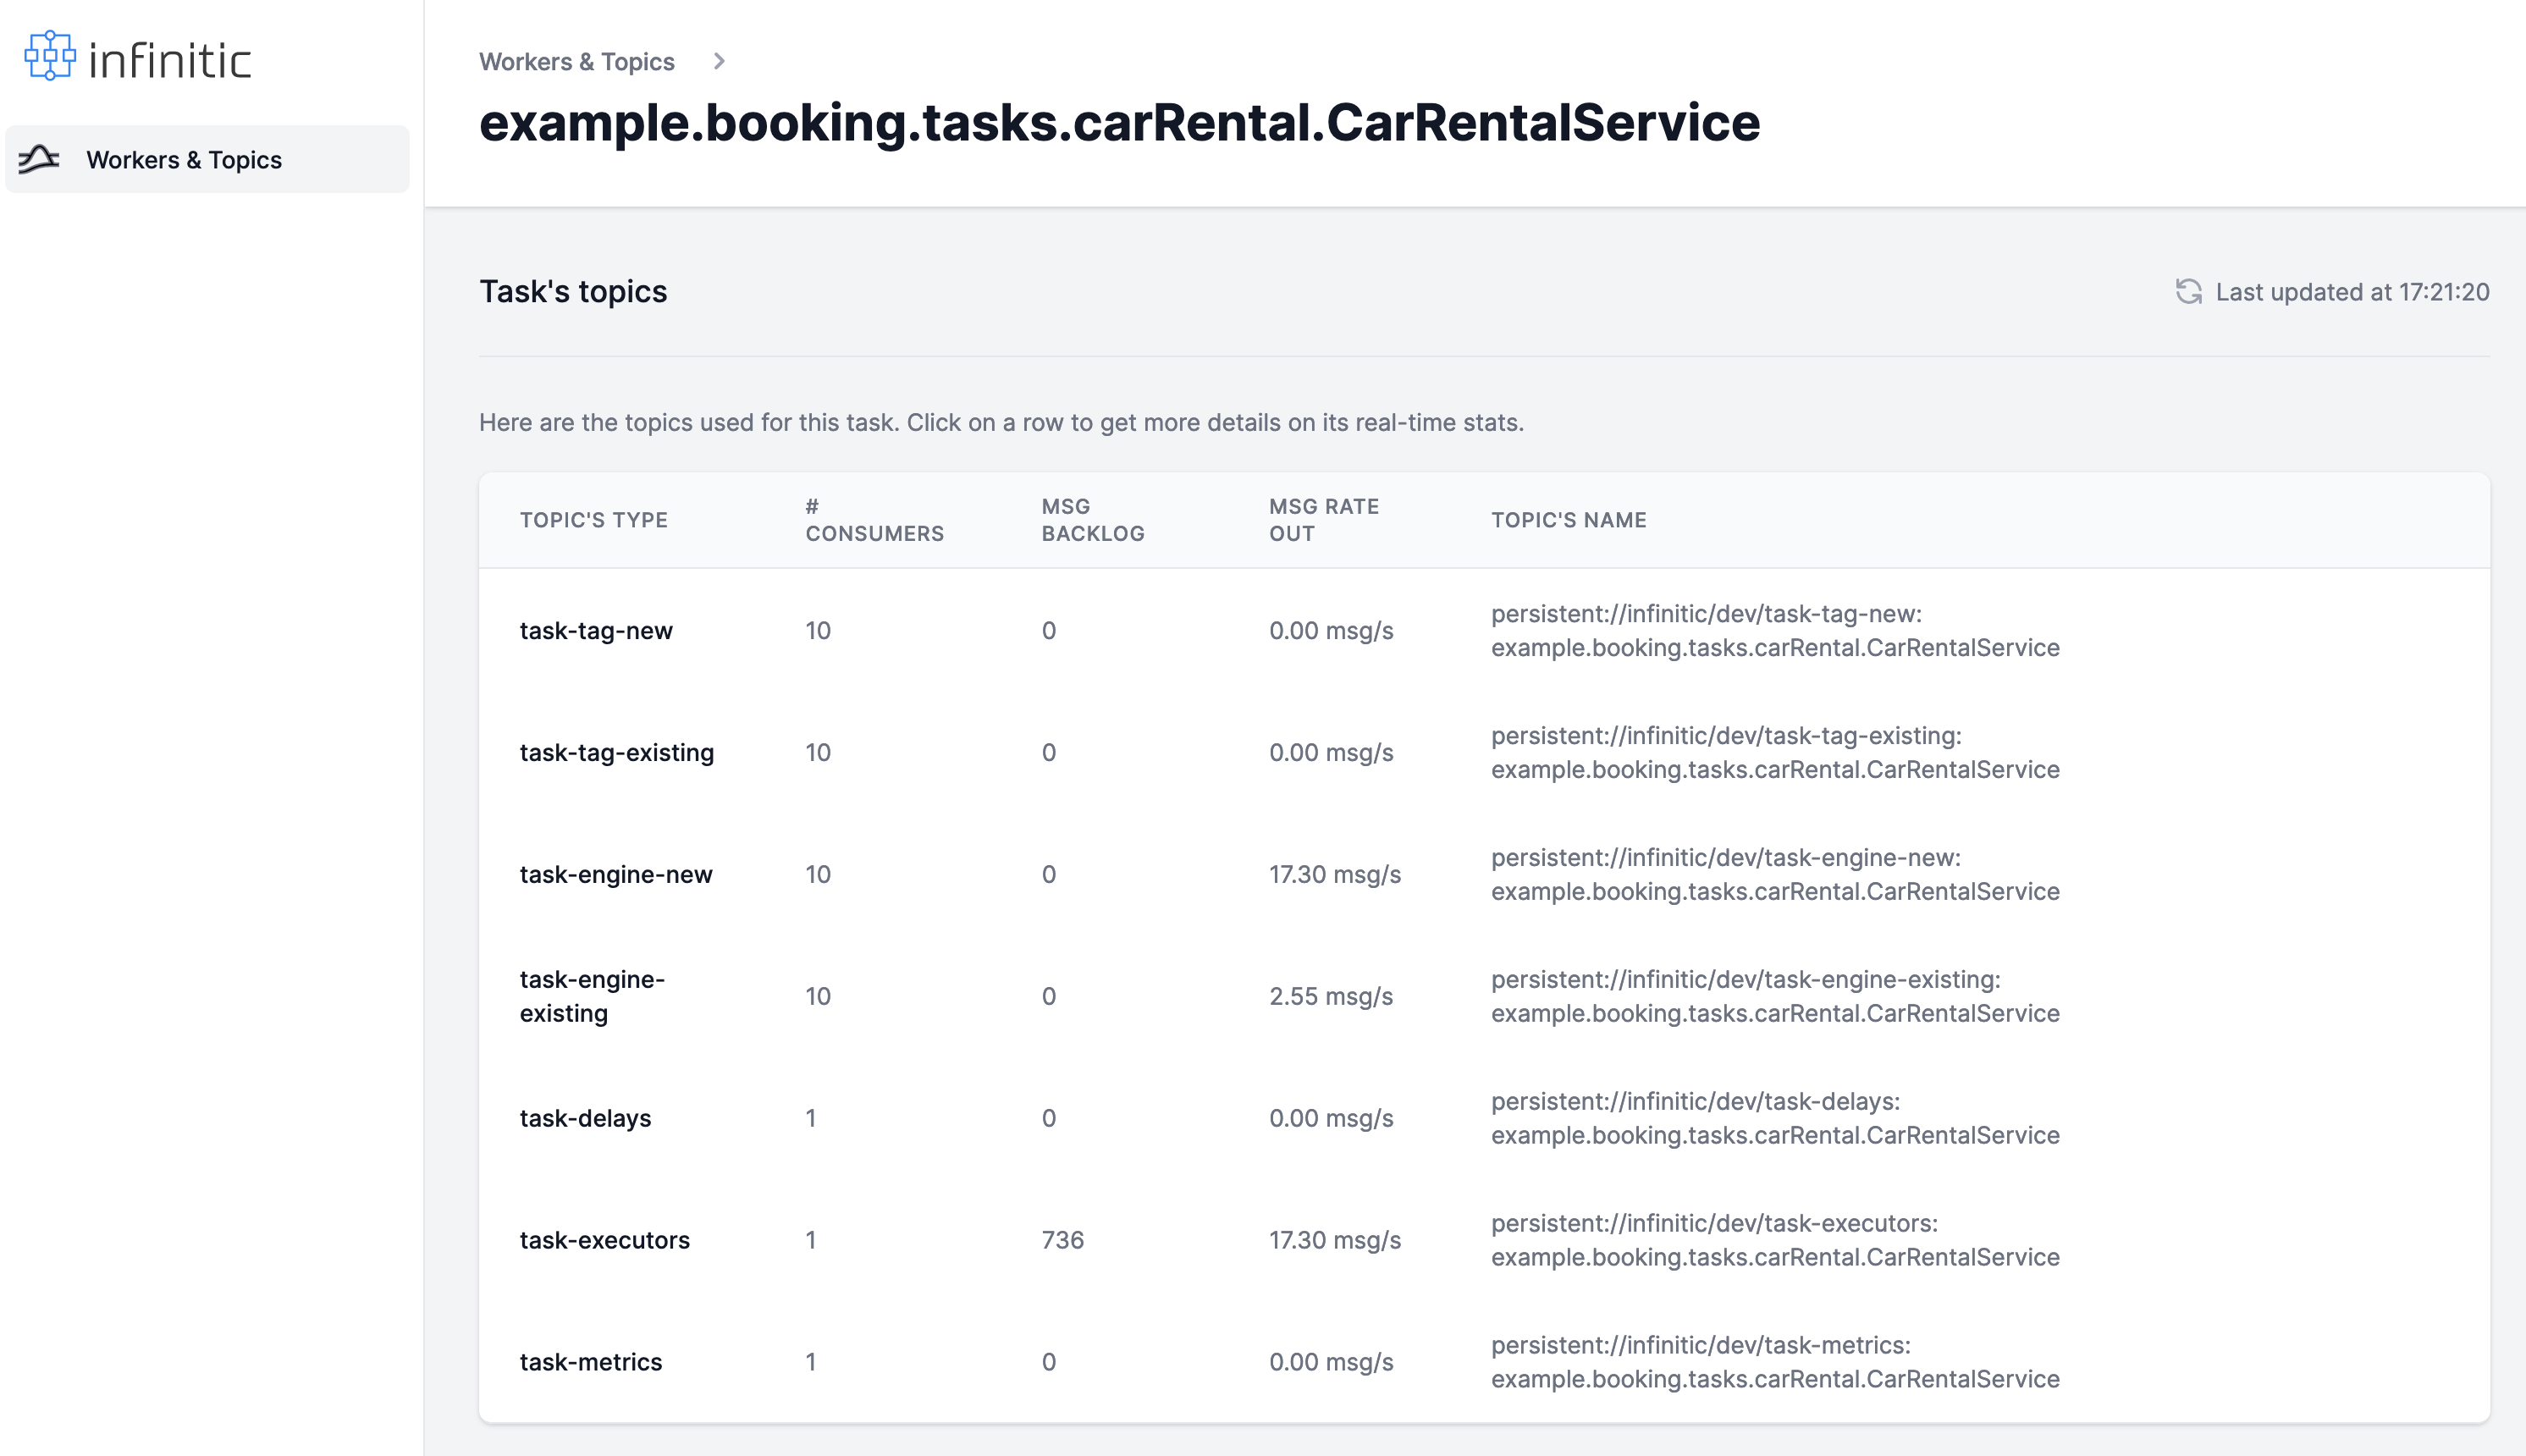
For each task name, a set of topics are automatically deployed on Pulsar:

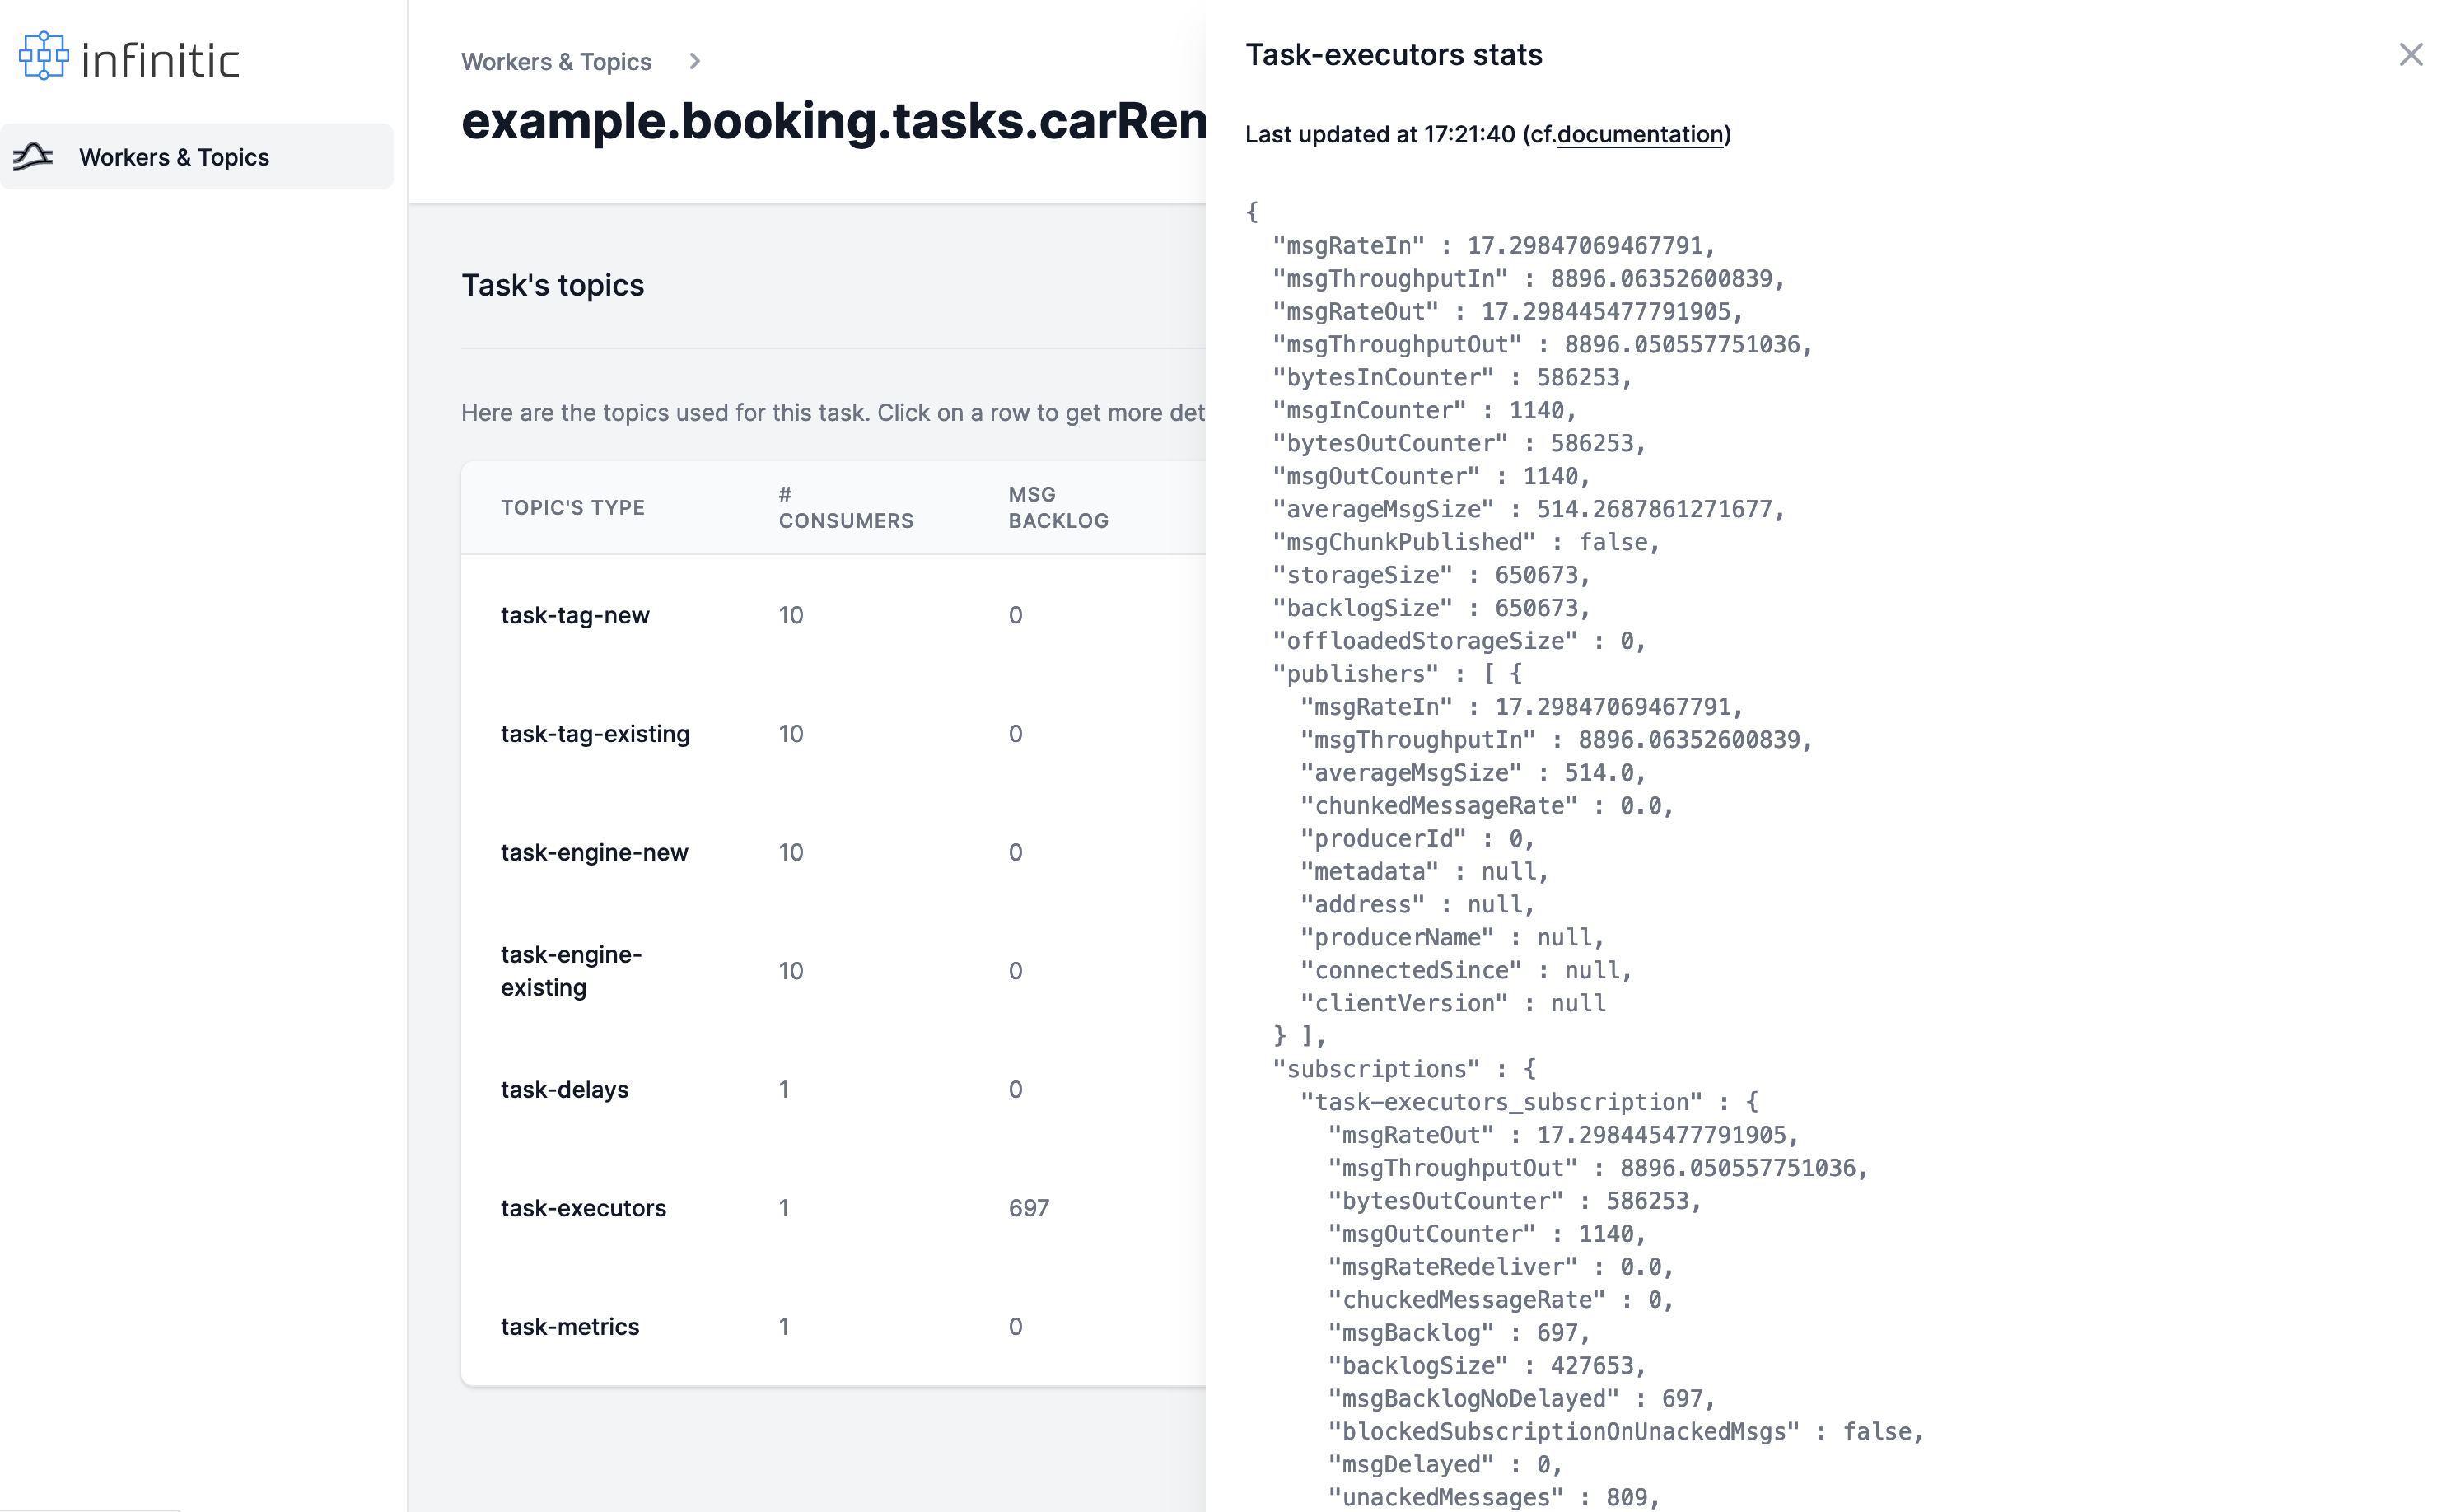
By clicking on a task name on the dashboard, we can see the real-time statistics of all of them:
Stats for a topic
Note that for each topic, we can see the very detail of its metric by clicking on it:
